Using the TimeSeries Class
The TimeSeries Class is used to generate realizations of specific time series and extract their blockmaxima
[1]:
import xtremes as xx
import xtremes.topt as hos
In this section, we create a TimeSeries object TS using the xtremes.HigherOrderStatistics module. The time series is generated with the following parameters:
n=1000: The length of the time series.distr='GEV': The distribution type, which is the Generalized Extreme Value distribution.modelparams=(0.5, 0.1, 0.1): The parameters for the GEV distribution.
We then simulate 200 realizations of this time series using the simulate method.
Finally, we extract the block maxima from the simulated time series with a block size of 10 using the get_blockmaxima method:
[2]:
TS = hos.TimeSeries(n=1000, distr='GEV', modelparams=(0.5,0.1,0.1))
TS.simulate(rep=200)
TS.get_blockmaxima(block_size=10)
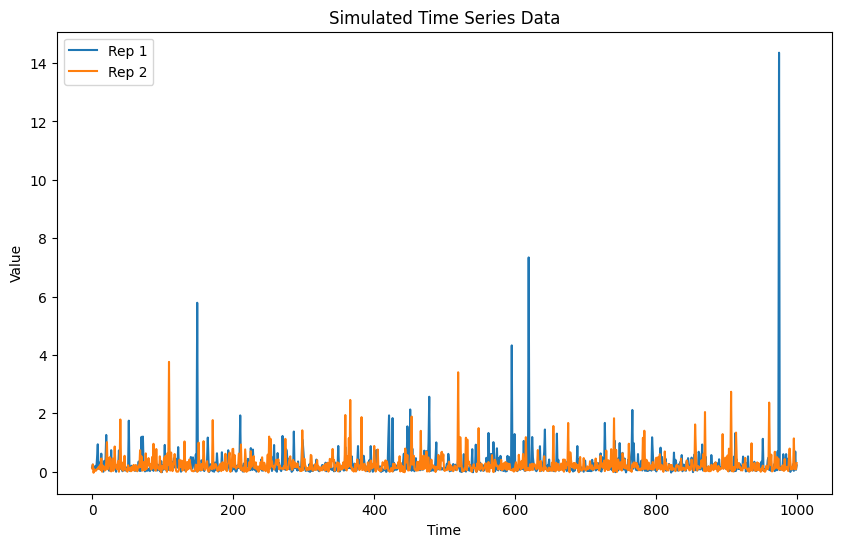
The TS.plot(rep=[1,2]) method is used to plot specific realizations of the time series. In this case, the method will plot the first and second realizations of the time series TS. This is useful for visualizing the behavior of the time series over different realizations and understanding the variability in the data.
[3]:
TS.plot(rep=[1,2])
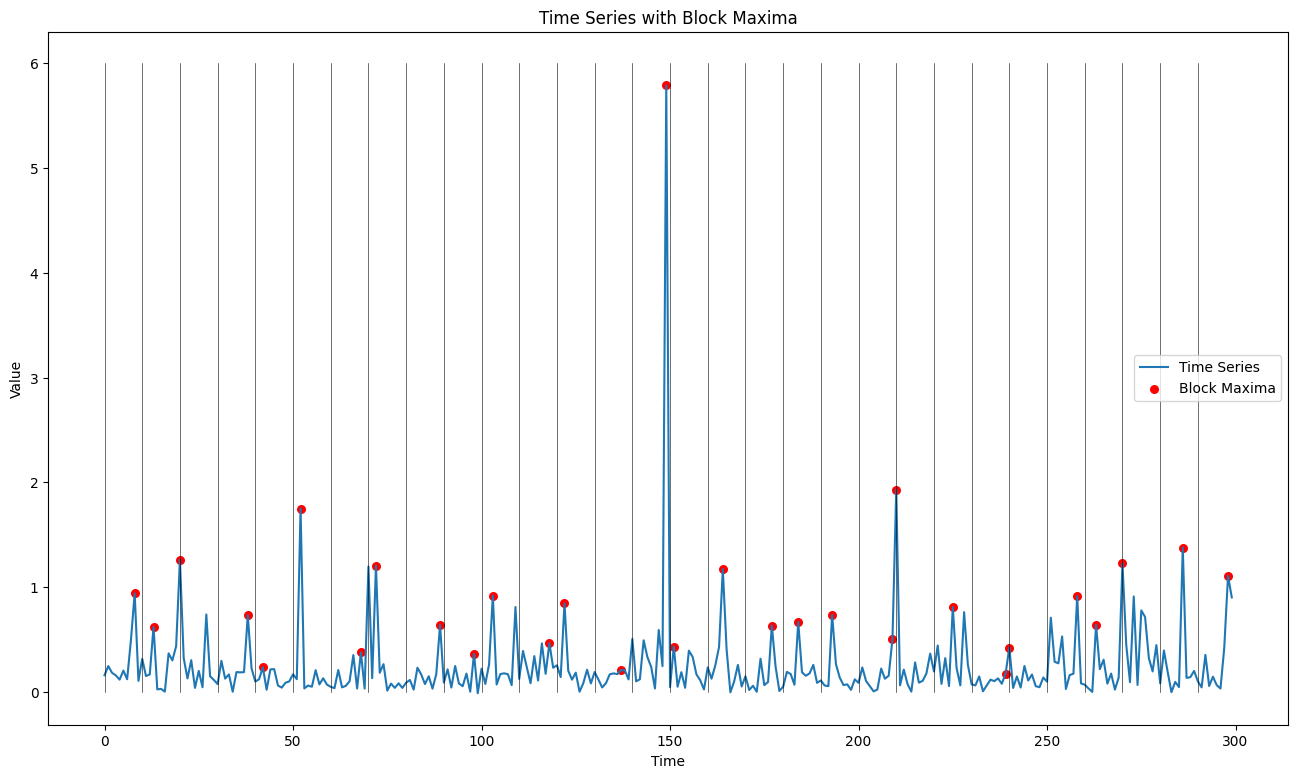
The TS.plot_with_blockmaxima() method is used to visualize the time series along with its block maxima. This method plots the original time series data and overlays the block maxima on the same plot. This is useful for identifying extreme values within the time series and understanding how these extremes are distributed over time.
By visualizing both the time series and its block maxima, one can gain insights into the behavior of extreme events and their frequency.
[4]:
TS.plot_with_blockmaxima()
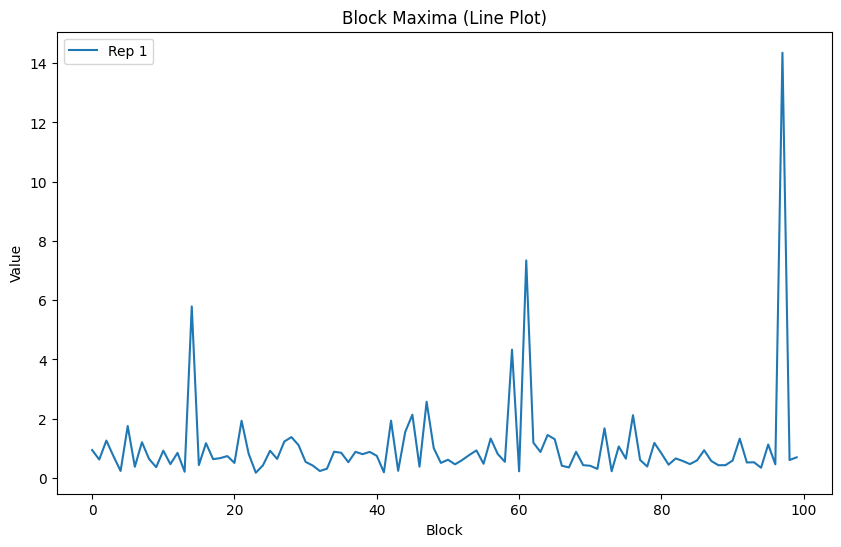
The TS.plot_blockmaxima(rep=1) method is used to plot the block maxima of a specific realization of the time series. In this case, the method will plot the block maxima for the first realization (rep=1).
[5]:
TS.plot_blockmaxima(rep=1)
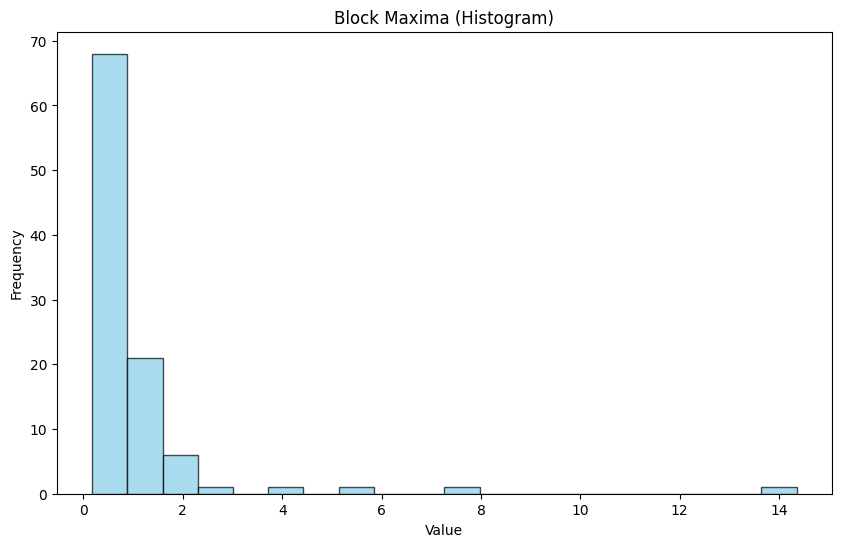
The TS.plot_blockmaxima(rep=1, plot_type='hist') method is used to plot the block maxima of a specific realization of the time series as a histogram. In this case, the method will plot the block maxima for the first realization (rep=1).
By setting the plot_type parameter to 'hist', the block maxima are visualized in the form of a histogram, which helps in understanding the distribution of the block maxima values. This is useful for analyzing the frequency and range of extreme values within the time series.
[6]:
TS.plot_blockmaxima(rep=1, plot_type='hist')